-

- ***
- ***
- ****
1
Examination Information
You can check the evaluation information such as the Test Name, the Test Date, the Applicant No., and the level.
2
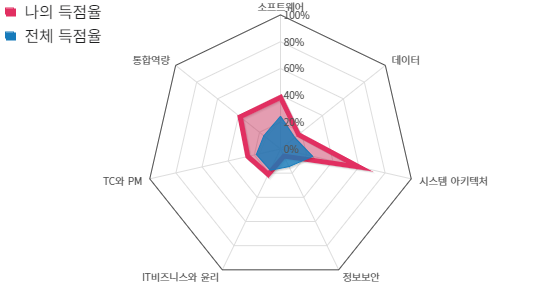
Comprehensive Test Score Analysis Tab
You can check the Comprehensive Test Score Analysis result in the Test score.
Comprehensive Analysis
| Correct | Score | Percentage | Country Average | Top 30% | Top 10% |
|---|---|---|---|---|---|
|
29/65
3
Answered CorrectThe number of scoring problems that have scored against the total number of problems per module is displayed. |
315/1000
4
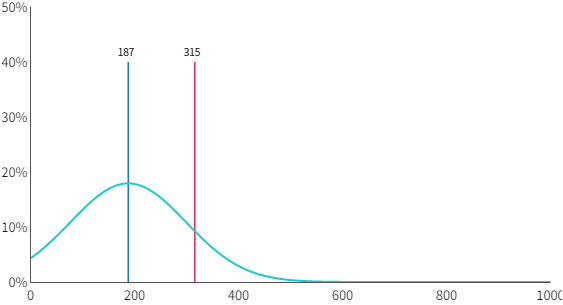
Your ScoreThe score of the applicant's against the full score is displayed. |
31.5%
5
PercentageThe score of the applicant's converted to percent is displayed. |
187.0
6
Country AverageTop 30% and top 10% of the module-specific score means are displayed. |
328.9
|
417.9
|
Industry Competency Standard
Accuracy rate of basic practical knowledge in future core technologies such as AI data.Comprehensive Score Analysis
Subject has basic knowledge and skills required in the technical and business fields of SW/IT, but needs more training.
- Has fundamental understanding of the technical and business fields in SW/IT, but problems solving skills are limited due to the lack of sufficient experience.
7
Competency Level Diagnosis
Based on the TOPCIT score, the applicant's competency level is presented.